Wednesday, December 30, 2015

American Fault Line


By J. Mac Holladay, Founder and CEO

On December 9th, I was fortunate to attend a powerful presentation in Charleston, South Carolina featuring Ken Burns and Dr. Henry Louis Gates, Jr. The title was American Fault Line: Race and the American Ideal. These two icons previewed the new documentaries they are currently working on and participated in a roundtable discussion. The sold out event was held in the beautifully restored Galliard Center in support of the International African American Museum. Ironically, the date of the event was forty years to the day since the first election of Joseph P. Riley, Jr as Mayor of Charleston. After many many great projects, the Museum project is Mayor's Riley's final gift to his community.

As I listened to the two men speak, I thought about the reality that over 40% of all the slaves brought to the United States came to one single wharf in Charleston. That exact location is that place that the Museum will be built. Unlike anything ever envisioned, the Museum will tell the story of those forced to come here as slaves all those years ago. It will tell their story, not only of all they did to build magnificent buildings across the nation as artisans, but the songs and poetry they wrote and how they survived the awful treatment they endured not for decades but for generations. The Museum will chart all that their descendants have done as professionals, elected officials, community and religious leaders as a key part of American history. As Dr. Gates said, "we must take it all in, that is the value of history." The Museum will create a new inclusive American history curriculum for elementary school students and offer continuing education for all who visit.

As many events in 2015 have shown us, racism is not dead. From the over reaction of a North Charleston policeman shooting an unarmed man in the back to the horrible murder of nine people attending a Bible study class at Mother Emmanuel AME Church across the street from the Galliard, we have seen a strange twist in our recent history. Many more negative events have cascaded across the nation all year long. In 2008, many of us had hoped that the election of Barrack Obama as President would change the past. In fact, the reverse has happened. There has been a real increase in blatant racist activities since his second election. As one young African American farmer in Arkansas stated in Paul Theroux’s new book, Deep South, “The Klan don’t wear sheets. They are sitting behind the desks in the banks.” Today, there are 42 million African Americans in the "middle class" and yet 38% of black children live in poverty. Prejudice has consequences every day.

We have only one history in America, it includes all of us. As Mark Twain said, "travel is the enemy of prejudice." So we must share the culture and facts that make us who we are. We must make sure that our children and our grandchildren know all the history of our country. Celebrating black history should not be isolated to a single month, it should be every day, every week, and every month as their history is ours and part of who we all are.

Wednesday, December 23, 2015

Words

By Mike Gaymon, Senior Advisor

The Christian Recorder in March of 1862 published that a publication of the African Methodist Episcopal Church presented the adage of "Sticks and stones will break my bones but words will never harm me" for the first time in print. 

Most of us will never have sticks and stones thrown at us as was done during this time of our nation's history. It was a different time for sure but today we live in much different times as well.  But we will all experience words that are powerful, sharp and can be as beneficial as they are destructive.
 
Our team at Market Street focuses on using words (with lots of numbers) to tell a story of the past, the present, and glimpses of what the future may hold for cities, counties and states.  These words while always as accurate as possible can be well received or sometimes not welcomed.  After all, most communities don't want to hear the bad news about their previous decisions or future paths unless major changes are made.  Most want to hear about the successes and the great achievements that worked well.

However, in my opinion, one of the foundation blocks of MSS that has never been compromised is "telling it like it is....the good, the bad, the ugly."  Leaders need to be confronted with the reality of where they actually are and probably will be going in community and economic development.  The future workforce will reap the results of the current leadership facing the reality of their decisions.

Words, followed by a committed leadership to execute them into actions, will determine what the future community will become. They will challenge, empower and help to create a vision for the future.  It may be just words but they can be transforming.

Thursday, December 17, 2015

The Big Issue at Year-End 2015


By Jim Vaughan, Senior Fellow 

Last year, in December, I posted a blog entitled, Nuggets of wisdom, interest, and of possible value in which I included quotes gleaned from my electronic clippings file that I thought might be of interest to economic developers and city builders. 

I planned a similar wrap-up for this year. Except that one item seemed to overshadow all the others. 

The Paris Climate Accord. 

This agreement is so important that economic developers and city builders must both understand the key elements of the global deal and help develop local plans to support our national climate goals. Going forward, Market Street Services will help our clients develop strategies to capitalize on the new reality of an economy in the post carbon era. 

* * * 

This is not my first post on this subject. I have written three blogs on climate change (Sorry Candidates, Climate Change Is Not a Hoax; Can We Still Do Big Things; and Climate Change: It’s No Laughing Matter) each making the case for action. Today’s post celebrates action. 

Here’s how I see it:

1. There is consensus to act. 196 countries approved the historic climate agreement
“The Paris agreement on climate change is a monumental success for the planet and its people.”U.N. Secretary-General Ban Ki-moon

2. The agreement provides a broad foundation for meaningful progress
"Anyone who suggests this is a success or a failure is only speaking based on ideology, not reality. Only 10 to 20 years from now, when we look at the implementation of all this, will we really know."Robert Stavins, director of the Harvard Environmental Economics Program

3. New technology has changed the rules
“Many people still seem to believe that renewable energy is hippie-dippy stuff, not a serious part of our future. The reality is that costs of solar and wind power are close to competitive with fossil fuels even without special incentives. (So) the cost of sharp emission reductions will be much less than even optimists used to assume.”Paul Krugman, The New York Times, Dec. 14, 2015

4. Businesses are preparing for opportunity
Chief executives of blue-chip companies like Coca-Cola, DuPont, General Mills, HP and Unilever all expressed support for an ambitious deal. BP, the British oil giant, called the Paris agreement a “landmark climate change deal” and pledged to be “a part of the solution.”Clifford Krauss and Keith Bradsher, The New York Times

“We have the technologies, we have the business incentive, and we have the responsibility. Now all we need is the commitment.”Joe Kaeser, CEO of Siemens

5. The climate accord provides confidence for investors
“Investors … will now have the confidence to do much more to address the risks arising from high carbon assets and to seek opportunities linked to the low carbon transition already transforming the world’s energy system and infrastructure.”Stephanie Pfeifer, chief executive of the Institutional Investors Group on Climate Changer

6. This is big, but it’s just a start
“Make no mistake, the Paris agreement establishes the enduring framework the world needs to solve the climate crisis." President Barack Obama

* * * 

On behalf of everyone at Market Street, here’s to a prosperous 2016! We look forward to following your successes in the New Year, and encourage you to follow us on Twitter for the latest thought-provoking community and economic development quotes, news, best practices, and innovations.

Thursday, December 10, 2015

Quality of Place and the Future of Parking

By Matt DeVeau, Project Manager

In the past few months, this blog has featured a couple of brief ruminations on how automation might drastically re-shape labor markets. It’s a fascinating topic with enormous implications for community and economic development. But despite the enormity of “the future of work” question, I think there are many more ways in which technological advancements might impact our field in some way.

I’m a city planning nerd at heart, so I spend a lot of time thinking about the physical spaces we occupy and the investments and policies that shape them. And I’m increasingly of the belief that technologically driven shifts in consumer behavior may soon lead to fundamental changes in our built environment. Given the importance of “quality of place” in areas such as talent attraction and retention, I thought I’d share one of these thoughts here. This isn’t going to be an amorphous ode to “disruption” or a far-out hypothetical. Instead, let’s start with a trend that is already well underway: ridesharing. 

I think we can by now skip the full “what is Uber?” explainer, but let’s at least pause to illustrate the general concept: you want to go somewhere, you open an app in your smartphone, summon a vehicle to your current location, plug the address of your destination into the app, and off you go. Needless to say, this type of service could not have existed prior to the widespread availability of smartphones and GPS, but once the technological conditions were right, the concept took off. Less than seven years since its founding, Uber has reached a valuation of $62.5 billion, bigger than General Motors. 

To me, the popularity of Uber and other ridesharing services is simple: they are affordable and convenient. So much so, in fact, that individuals in some markets might plausibly forgo car ownership altogether without adding costs or sacrificing much in the way of the freedom and independence available through vehicle ownership. I’ve done a few back-of-the-envelope calculations for Atlanta, and it was a close call depending on how I tweaked assumptions about things like commute distance, desire/ability to use other transportation modes on occasion, etc.

And that’s all with humans doing the driving. As we’ve discussed in this space previously, autonomous or “self-driving” vehicles are well into the testing and deployment stages. It may be quite some time before they are capable of reliably navigating complex and unpredictable surface streets as opposed to relatively simple and predictable travel along freeways. But any advancement in autonomous vehicle technology would serve to make ridesharing more viable.

So what does this all have to do with urban form? Parking. If your primary mode of transportation is a car, think about all the places you park throughout a day – your residence, your job, a store, a park, your place of worship, etc. That’s a lot of storage space, and it adds up. According to one recent estimate, 14 percent of the total land area in Los Angeles County was devoted to parking

But if ridesharing continues to advance as it has – and especially if significant headway is made on the autonomous vehicle front – then we could easily see many individuals (primarily but not exclusively in larger urban markets) drop car ownership in favor of “renting” on-demand rides. In this scenario, vehicles won’t sit idle while their owner is working, sleeping, shopping, or eating – they’ll simply move on to the next fare. And in this case, we won’t need nearly as much parking.

The planning and design implications of such a future are too weighty to get into here. And it’s not practical on any level – technological, political, etc. – to suggest an immediate wholesale change in our mindset. (Seriously, if you’ve never been to a commercial or multifamily residential rezoning hearing, stop by some time and see what issue dominates the conversation.) But the way we price and regulate parking has always been kind of a mess and this in turn has driven up development costs, chewed up land that could be economically productive with another use, and generally led to a built environment that is not made for humans. 

In the overall context of thinking about quality of place, communities should think about how attitudes towards things like parking might change in the coming years. Are existing regulations flexible enough for a future where demand for parking may fall and should we let market forces determine the answer to that question? (Imagine that.) Does it make long-term sense to direct public investments toward things like parking decks in the name of spurring private development in the short-run? Should communities begin to think about redevelopment strategies and frameworks should there prove to be a future excess supply of parking? These are all questions that I think are worthy of asking in a changing world.

Monday, November 23, 2015

To the Far East, a Glimpse into the Future

By Evan Robertson, Senior Project Associate

In the world of community, economic, and workforce development, it is easy to be United States-centric. So much of our important work is deeply impacted by our national, state, and local laws and policies. Even within the United States, each region of the country has vastly different, contrasting, milieus of community, economic, and workforce development. Beyond our nation’s boundaries community, economic, and workforce development can look downright alien. From time to time, however, looking past these differences can yield insight into new possibilities and assist in identifying solutions to challenges that local communities are likely to encounter in the future. 

We at Market Street have been deeply concerned with the sustainability of the nation’s workforce for a great deal of time - education and talent development remain core components of our processes, we view workforce sustainability as THE issue in our field. Communities who take talent for granted are likely to find themselves at a serious disadvantage in the coming years – recent headquarter relocations such as Expedia’s move from suburban Seattle to its downtown area and the Mercedes-Benz headquarter relocation into the Atlanta area (hint: transit accessibility was a major location factor) are just a few recent talent-driven relocations that highlight businesses’ thirst for locating in areas they perceive as being attractive to tomorrow’s workforce. If talent availability is our key community, economic, and workforce development issue, then the retirement of the baby boom generation is our greatest challenge. Of course, there are many unknowns regarding how communities and businesses will respond to the retirement of the baby boom generation – we simply haven’t experienced such a large swath of our workforce entering retirement age in such a short period of time. Will we fill gaps through promoting immigration? Will robots replace certain types of work? Will businesses selectively downsize? Will GDP be impacted? 

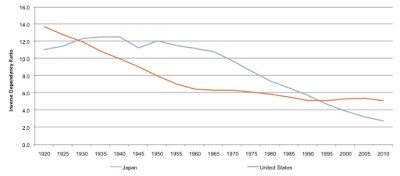
Luckily, for us at least, Japan offers a rare glimpse into the potential challenges and outcomes of severe workforce shortages caused by retirees exiting the labor force. Working age adults typically support retirees by generating tax revenue which, in turn, is used to support social services such as Medicare and social security, or in the case of Japan, its national pension system (Kokumin Nenkin) and the national healthcare system (Kokumin-Kenkō-Hoken). Inverse dependency ratios (i.e. the ratio of residents aged 15 to 64 aged divided by residents aged 65 and over) are a quick and easy way to determine just how many working age adults there are to support a nation’s retiree population. As the following chart displays, Japan’s number of working age adults relative to its retiree population has dropped precipitously since records began in 1920. In 1920, there were roughly 11 residents aged 15 to 64 for every individual aged 65 and over in Japan. By 2010, there were only 2.8 residents aged 15 to 64 for every individual aged 65 and over in the county. By comparison, the United States’ dependency ratio, while in similar decline, has been less severe (the United States’ dependency ratio stood at 5.8 in 2010). These figures are likely to slip further, Japan’s own population projections foresee a continually aging population long in to 2060. As Japan’s workforce continues to enter retirement age, well before the United States’ pending baby boom retirements, it offers communities a clear picture into their future. Thus far, the impact in Japan has been startling. 

Inverse Dependency Ratio for Japan and United States, 1920 - 2010 


Source: Ministry of Internal Affairs and Communications, Statistics Bureau; U.S. Census Bureau 

A recent Wall Street Journal article describes the profound impact talent shortages are having on Japan’s economy. The country’s gross domestic product declined at an annualized rate of 0.8 percent in the third quarter according to the article, this is particularly interesting since Japan’s unemployment rate stands at 3.4 percent. With the vast majority of the nation’s population employed, one would expect that gross domestic product would be on the rise. Due to the lack of available workers, Japanese companies are cutting back. One company detailed in the article had to close around twenty percent of its approximately 2,000 24-hour restaurants during late night hours. This would be akin to Waffle House locking its doors from say 12 a.m. to 6 a.m. not because there weren’t customers at those hours to sustain the business (trust me, there are), but there was simply no one available to tend to the store during that time. Japanese companies who require more highly skilled talent report intense competition for workers, with highly skilled employees often receiving numerous job offers from other competitors. 

As you might suspect, much akin to the United States, Japan’s urban centers typically possess a lower concentration of residents aged 65 and over compared to other areas of the country. As the following map shows, those prefectures in and around Tokyo; Nagoya, and Osaka generally possess a younger population. Much like in the United States, Japan’s urban cores and their ability to develop a built environment attractive to young Japanese residents as well as new immigrants alike will be central to the success or failure of addressing the country’s talent shortages. 


If there is one major takeaway, it is this: watch Japan closely over the coming years. They are the first nation to experience a severe workforce shortage caused by a large portion of their population retiring within a short window of time. The policy responses they formulate both at the local and national level may offer ideas to other communities on how to attract and retain top talent in a given community. They could very well earn the distinction of creating new, innovative talent attraction and retention best practices. Of course, some of the policy responses will be out-of-reach to local leaders stateside. A local community’s ability to impact national immigration policy is limited. Other policies, especially those that pertain to welcomeness, inclusion, and place making, will likely provide fertile ground for adoption or tailoring a particular policy to your local community.

Wednesday, November 11, 2015

Hancock County at a Bird's Eye View

By Ranada Robinson, Research Manager

In the first installment of our post about Hancock County, MS and its journey since Hurricane Katrina, we talked about the county’s success in bouncing back and rebuilding its community and economy. This installment takes a look at a few key indicators to begin to see the dynamics of that progress. This brief analysis is but a glimpse of the many data indicators we at Market Street explore during our strategy processes to understand a community’s story.


As shown in the following population table, Hancock County has not reached its population levels immediately before Hurricane Katrina hit, but it is very close and steadily growing. As shown clearly in the Population Index chart, which allows apples-to-apples comparison of growth rates despite geography size, Hancock County’s comparatively rapid population growth is catching up to the state’s steady growth over the time period.


In terms of age dynamics, in 2014, Hancock County has the same percentage of 25-44 year olds in its population (23.8 percent) as it did when Market Street developed the community’s Competitive Assessment in 2011, when the most recent age data available was 2009. The population of retirees (65+) has increased to 17.3 percent, while the proportion of children 17 and under has decreased to 22.1 percent.


POPULATION
Source: U.S. Census Bureau Population Estimates


POPULATION INDEX, 2001 = 100
Source: U.S. Census Population Estimates


In terms of employment, the county bounced back very quickly, then began a consistent incline until 2010. Since then, there has been a decrease in jobs, mostly in construction, administrative and support services, manufacturing, and transportation and warehousing. In the last four years, the greatest number of added jobs has been in retail trade, accommodation and food services, and healthcare and social assistance. Despite this shift, average annual wages have continued to rise, establishments are opening, and unemployment is still on the decline.


EMPLOYMENT
Source: Economic Modeling Specialists Intl. (EMSI)


EMPLOYMENT INDEX, 2001=100
Source: Economic Modeling Specialists Intl. (EMSI)


UNEMPLOYMENT
Source: U.S. Bureau of Labor Statistics


AVERAGE ANNUAL WAGES
Source: Economic Modeling Specialists Intl. (EMSI)


ESTABLISHMENTS
Source: U.S. Bureau of Labor Statistics


For resident well-being, I took a quick look at per capita income and poverty rates. Per capita income shot up after Hurricane Katrina, presumably due to government assistance and those who took advantage of dividends and interest income to help them through the rebuilding phases. Since then, the PCI has returned to pre-Katrina levels, closer to the state PCI. Poverty and youth poverty are gradually increasing over time, which is also a national and state trend. 


PER CAPITA INCOME, 2001-2013
Source: U.S. Bureau of Economic Analysis


COMPONENTS OF INCOME, HANCOCK COUNTY, 2001-2013
Source: U.S. Bureau of Economic Analysis


POVERTY
Source: SAIPE


YOUTH POVERTY
Source: SAIPE


Again, this is only a peek in the window of all the data that helps to tell Hancock County’s story. As with all communities, other indicators such as migration trends, educational attainment, racial and ethnic dynamics, economic structure analysis, and many quality of life indicators are instrumental in understanding how far a community has come and in what direction it’s going. Nevertheless, it is astounding the progress that Hancock County was able to make in just the couple of years following Hurricane Katrina. As it continues moving forward in the future, we at Market Street will continue rooting for them, and wishing them well in their efforts to increase their economic vitality, enhance their position as a community of choice, prepare a 21st Century workforce, and develop and support visionary leadership.

Thursday, November 5, 2015

If Increasing Automation Becomes A Reality, The Impacts Will Be Broad


By Matt DeVeau, Project Manager 

Confession time: I get sucked into reading a lot of clickbait articles. I believe (or rationalize, anyway) that I am a victim of circumstance. I have a public transportation commute that typically involves about 25-30 minutes of standing on crowded train or waiting for one, and the best way to pass the time is on my phone. It happens. 

Lately I’ve been falling for “robots are going to take all the jobs!” headlines. On some level, these kinds of sensationalist pieces are understandable. Let’s say that within the next few decades, a huge portion of existing jobs are lost to automation or increasingly advanced algorithms and are not replaced by new kinds of work for whatever reason. In that scenario, it’s not hard to imagine that every facet of society – economy, culture, politics, and so on – will be radically altered. That’s scary! And that’s why it makes for good #content on certain websites. 

To be sure, there are plenty of serious and worthwhile pieces about the “future of work” in an increasingly automated world – Evan Robertson briefly touched on the topic in this post from September. It’s fun to think about the theoretical aspects of these articles and think through the long-range questions they raise. But as an economic development professional, I’m also drawn to some practical questions: what types of occupations are most at risk and how are these jobs distributed geographically? 

These are obviously enormous questions that can’t be adequately addressed in this space, but I took a quick initial look at the issue using findings from existing research and EMSI occupational data. The foundation for this brief analysis is a 2013 study from Oxford University titled “The Future of Employment: How Susceptible are Jobs to Computerization?” The authors, Carl Benedikt Frey and Michael A. Osborne, devised a methodology to estimate the probability that 702 occupations can be automated. Each occupation is ranked on a scale with a number between 0 and 1, with 1 representing the jobs that are most likely to be computerized. 

I looked specifically at the 171 occupations with a probability of 0.9 or higher. This “high-risk” category accounts for nearly 45 million jobs, roughly three out of every 10 positions in the United States. It includes the nation’s most common job – retail salesperson – and some of its most obscure. (Side note: there are apparently 3,774 bridge and lock tenders in the United States.) A large majority of these jobs, however, were clustered into four major occupational groupings: 
  1. Office and Administrative Support Occupations (14.0 million) 
  2. Sales and Related Occupations (9.9 million) 
  3. Food Preparation and Serving Related Occupations (8.1 million) 
  4. Production Occupations (4.5 million) 

The above categories all make sense in light of advancements in fields such as robotics, mobile payments technologies, big data, and machine learning. We might also add a fifth category based on another emerging technology, self-driving vehicles, but while many Material Moving occupations had high computerization probabilities, most fell below the 0.9 threshold. In any case, the diversity of the above categories indicates that no regional economy is completely immune from the threat of automation. In the nation’s 300 largest metro economies by total employment, the 171 “high-risk” occupations account for anywhere between 18.9 and 40.5 percent of local jobs. A further look at the regional economies in which these occupations are most concentrated also reveals a pattern. The following table shows the ten regions with the highest combined location quotient for the 171 occupations: 

Ten Regions With the Highest Proportion of Jobs at High Risk of Computerization Among the Top 300 MSAs by Total Employment 

Source: EMSI 


All of the above regions have a location quotient of 1.94 or higher in either the Team Assemblers or Waiters and Waitresses occupation, reflecting a heavy concentration of economic activity around manufacturing or travel and tourism, respectively. Conversely, the following table shows the communities with the lowest concentration of high-risk jobs: 

Ten Regions With the Lowest Proportion of Jobs at High Risk of Computerization Among the Top 300 MSAs by Total Employment 

Source: EMSI 

In most of these communities, there is a dominant industry that does not rely heavily on or more of the above 171 occupations: government in Washington, DC, destination healthcare in Rochester, the military in Clarksville, Fayetteville, Jacksonville, and Killeen-Temple, and agriculture in Bakersfield, Salinas, and Yuma. The outlier is San Jose, which has strong location quotients in occupational categories related to computers (4.05) and engineering (3.09). These occupational categories just so happen to contain many of the jobs (e.g. software developers) that are at a relatively low risk of computerization in the coming years. 

Silicon Valley is a completely unrealistic point of comparison for just about every other regional economy in the United States. But even in the nation’s premier technology and software hub, more than 275,000 jobs – roughly one in four positions in the region – are in occupations that have a high probability of computerization. Put another way, if impending automation is a concern for a full quarter of workers in the place where a lot of the software is actually being developed, it’s a concern for everyone.

Wednesday, October 28, 2015

Food Insecurity Still a Threat to Many Communities

By Ryan Regan, Project Associate

The world recently celebrated World Food Day, an international day of recognition that seeks to raise awareness about the prevalence of worldwide hunger. Even in the year 2015, persistent hunger and malnutrition (especially among children) remains a chronic problem in many countries. According to the World Food Programme of the United Nations, poor nutrition is the cause of death in almost half of the world’s children under the age of five, and one out of six children in developing countries is underweight. 

Sadly, it comes as no surprise that issues of hunger and malnutrition are especially acute in developing countries, but food insecurity also affects millions of Americans, and overcoming this obstacle is a community development challenge that is deserving of more attention. The term “food desert” is used by the U.S. Department of Agriculture to describe mainly low-income communities that lack access to reliable sources of affordable fresh produce and other healthy food items. Urban census tracts that are located beyond one mile of a suitable food source and rural census tracts that lack similar access within 10-miles are the distinguishing factors of food deserts. The USDA’s Economic Research Service estimates that 23.5 million people live in food deserts in the United States, and about 2 million of those live in the state of Georgia

The prevalence of food deserts in the United States is another reminder of the economic disparities that plague the world’s wealthiest country, which unfortunately too oftentimes fall along lines of race and ethnicity. Consider the fact that all of the top-10 most food insecure counties in Georgia, listed by the Robert Wood Johnson Foundation program’s County Health Rankings index, are in majority-minority counties. In my home state of North Carolina, the top-12 most food insecure counties are all majority-minority counties. Unsurprisingly, these counties are also plagued by poor health outcomes like high rates of obesity and diabetes. It has been well-documented by the Centers for Disease Control and Prevention that racial and ethnic minority populations are disproportionately burdened by poor health outcomes, and it’s hard to ignore the impact that food insecurity has on this reality. 

Community and economic development is such a broad field that it can be easy to forget how important something as seemingly basic as healthy food can be to the overall equation. A community is only as strong as its workforce, and ensuring that the local workforce has equitable access to affordable, healthy food options is essential to maintaining its long-term sustainability. Expanding a community’s healthy food options can also support the local economy through increased job opportunities, especially via small locally-owned businesses. 

Here’s a look at a few examples of community-based food organizations that are helping to meet the healthy food needs of underserved communities: 

· Added Value – This organization supports sustainable development in the heart of Brooklyn by promoting urban farming enterprises. Over ten years ago, they developed the Red Hook Community Farm, a thriving 3-acre community farm that sits on an old abandoned school lot. The farm eventually became so successful that it spurred the creation of a farmers market that runs from June-November. Just last year, 20,000 pounds of produce was produced by the farm and made available to local residents at affordable prices. 

Through a creative youth empowerment program, Added Value trains and mentors up to 25 local teens per year in a hands-on learning environment that teaches them the value of hard work and healthy foods. The farm also serves as a popular field trip destination for thousands of area students who get an opportunity to hear about the farm’s farm-based learning programs. The employment, mentorship, and learning opportunities made available at the farm are helping to keep high-risk youth engaged in their community. 

· Nuestras Raices – The English translation of this group is “Our Roots,” which is an apt description of this community-driven organization that promotes economic, human, and community development in Holyoke, Massachusetts. The organization was created in 1992 by a group of migrating farmers from Puerto Rico who saw a need for community leadership in a community saddled with extreme poverty and economic despair. Putting their agricultural acumen to good use, they started a community garden on an abandoned lot that was previously a hotbed for criminal activity. This one garden created a domino effect and Nuestras Raices now has a network of 12 community gardens with over 100 member families who grow thousands of dollars’ worth of produce on their garden plots each year. 

More importantly, the organization has facilitated the development of the social capital and community bonds that are invaluable to a community. Nuestras Raices now operates an environmental program that addresses environmental issues in the community, a youth program that engages youth and teaches them the economic and health benefits of community gardening, and a financial literacy program that teaches residents about the value of home ownership and entrepreneurship. 

· Taos Food Center – Located in Taos, New Mexico, the Taos Food Center is a core program of the Taos County Economic Development Corporation. The Taos Food Center boasts over 5,000 square feet of commercial kitchen space and industrial-grade appliances that have served the needs of over 100 small businesses in the Northern New Mexico area over the past 20 years. The Taos Food Center has been both a great economic and cultural resource for the community that has helped to revive rich American Indian and Hispanic culinary traditions and provide economic opportunities to these disadvantaged groups. In addition to the business benefits of the space itself, the Taos Food Center also offers technical assistance services in the form of specialized training, product development, regulatory assistance, and marketing assistance. 

Promoting economic opportunity should be an inherent goal of any economic development strategy. Food insecurity is one of the many forms of inequality that plague so many communities across the country. Community leaders need to see the value in promoting equitable healthy food access, especially in low-income neighborhoods, so that all residents can have the equal opportunities they deserve to be productive workers and citizens.

Monday, October 19, 2015

Economic Outlook

By Katie Thomas, Project Associate

Last week I was able to attend Moody’s Analytics Economic and Consumer Credit Briefing here in Atlanta. This annual presentation by top economists covered U.S. macro, regional, and consumer credit outlooks. They presented on a wide range of topics, and while there are no guarantees for what the next year holds, economic modeling and forecasting provide greater context to current trends and what expectations are for the coming year. The following is a summary of just some of the topics that were discussed. 

Labor Market and Consumer Spending 


· Labor market indicators suggest that the U.S. is approaching full employment. Recent job growth has continued to outpace the growth in the labor force, as unemployed workers and marginally attached workers are absorbed and the labor market has tightened. The pool of workers is also unlikely to grow as baby boomers retire, which will put more pressure on the labor market.

· Underemployment – individuals that work part-time for economic reasons – is expected to decline as well. The most recent BLS report estimated that there were roughly six million individuals working part-time that would prefer to be working full-time but have been unable to secure such a position, also known as involuntary part-time employment. Another 2.5 million workers were marginally attached to the labor force. Both measurements have been declining over the past year and the underemployment gap has been shrinking.

· Wages are expected to increase as a result of a tighter labor market. Wage growth has been stagnant over the past five years, but as competition for talent and workers increases, additional upward pressure will be put on wages.

· With an increase in wages, consumer confidence will increase, and with it, we will see an increase in consumer spending.

Interest Rates and the Housing Market

· With the labor market approaching full employment, the Fed will want to begin raising interest rates in order to control inflation. Interest rate increases will likely happen relatively soon, possibly sometime between December and March.

· In early 2015, roughly 20.4 million young adults (18- to 34-year olds) were living with parents or relatives. As such, the multifamily housing sector is optimistic and predicts that there will be an increase in household formation over the next three years as millennials move in together.

· The median age of millennials is estimated to be 26, which is quickly approaching the average age of homebuyers – 32. They predict that the homeownership rate has bottomed out and will begin to increase as more millennials become homeowners which will create more demand for housing.

U.S. Regional Outlook

Much of the employment growth in the United States has occurred in the West and South, with both regions experiencing steady job gains. Meanwhile, employment growth in the Northeast has been modest but is improving. Employment in the Midwest and Great Lakes region is also improving, and it appears as though the worst is over for Detroit. Recovery will take a while, but its low business costs have spurred increased investment in the area. The labor market in the Midwest is very tight, and wages there will likely be among the first to be forced to increase due to the region’s slower than average growth to its labor force. The drop in oil prices has had a significantly negative effect on the western portion of the Southern states, though growth in the coastal southeastern states remains strong. In the housing market, residential construction permits have continued to increase across all regions, yet growth has also been strongest in the West and South regions.

While the overall outlook in the United States was positive, there are many uncertainties that could alter the projected course. The potential impact student loan debt could have, the risks associated with increased interest rates and its effect on investment, a possible financial crisis in emerging markets, and the recent Chinese stock market crash leave many questions in the air. Nevertheless, Moody’s was optimistic about the outlook for the upcoming year.